GrovePi and the Internet of Things
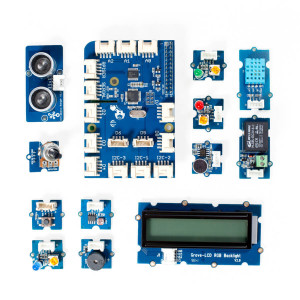 You might have heard of the GrovePi, a board for the Raspberry Pi that you can connect to hundreds of different sensors, so you can program them to monitor, control, and automate devices in your life.
There have been a number of projects and cloud services that are using the GrovePi as a hardware kit for the Internet of Things. A few cloud companies including Amazon, IBM, and SAP have built demonstration projects using the GrovePi and we wanted to highlight some of the things you can do with the GrovePi and cloud computing services.
Amazon
Amazon AWS Cloud
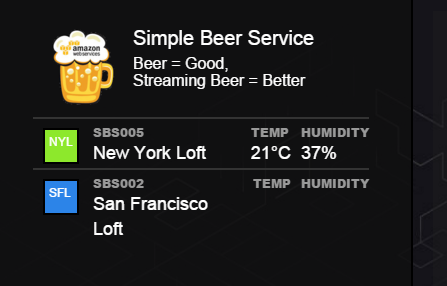 Amazon has creatively demonstrated their cloud service with the Simple Beer Service, a smart beer distributor. Monitor your beer temperature, beer flow, and ambient noise with this project.
The developers wrote a great post on the service here, and you can see the full plans and bill of materials for the project online here.
Initial State
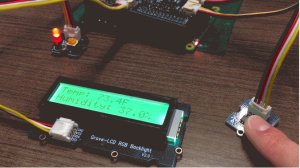 Initial State is an IOT data service that focuses on visualization and integration. They offer some fast and furious ways to see your data. In addition to great services, they also offer some really creative tutorials with the GrovePi (and GoPiGo!) that show you how to quickly get an IOT device assembled, streaming data, and visualized.
In one tutorial, they show how to turn the Raspberry Pi and GrovePi into a home automation hub using their service.
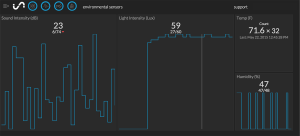
The awesome thing about the GrovePi is that you don’t even need a breadboard to connect a bunch of sensors to a Raspberry Pi. Using sensors that came in the GrovePi Starter Kit, I managed to make a simple “Home Environment Hub” to monitor different variables inside of a room in a couple of hours.
You can see their review of the GrovePi here. Head on over to Initial State to see what they’re brewing up next!
SAP
SAP Cloud Example
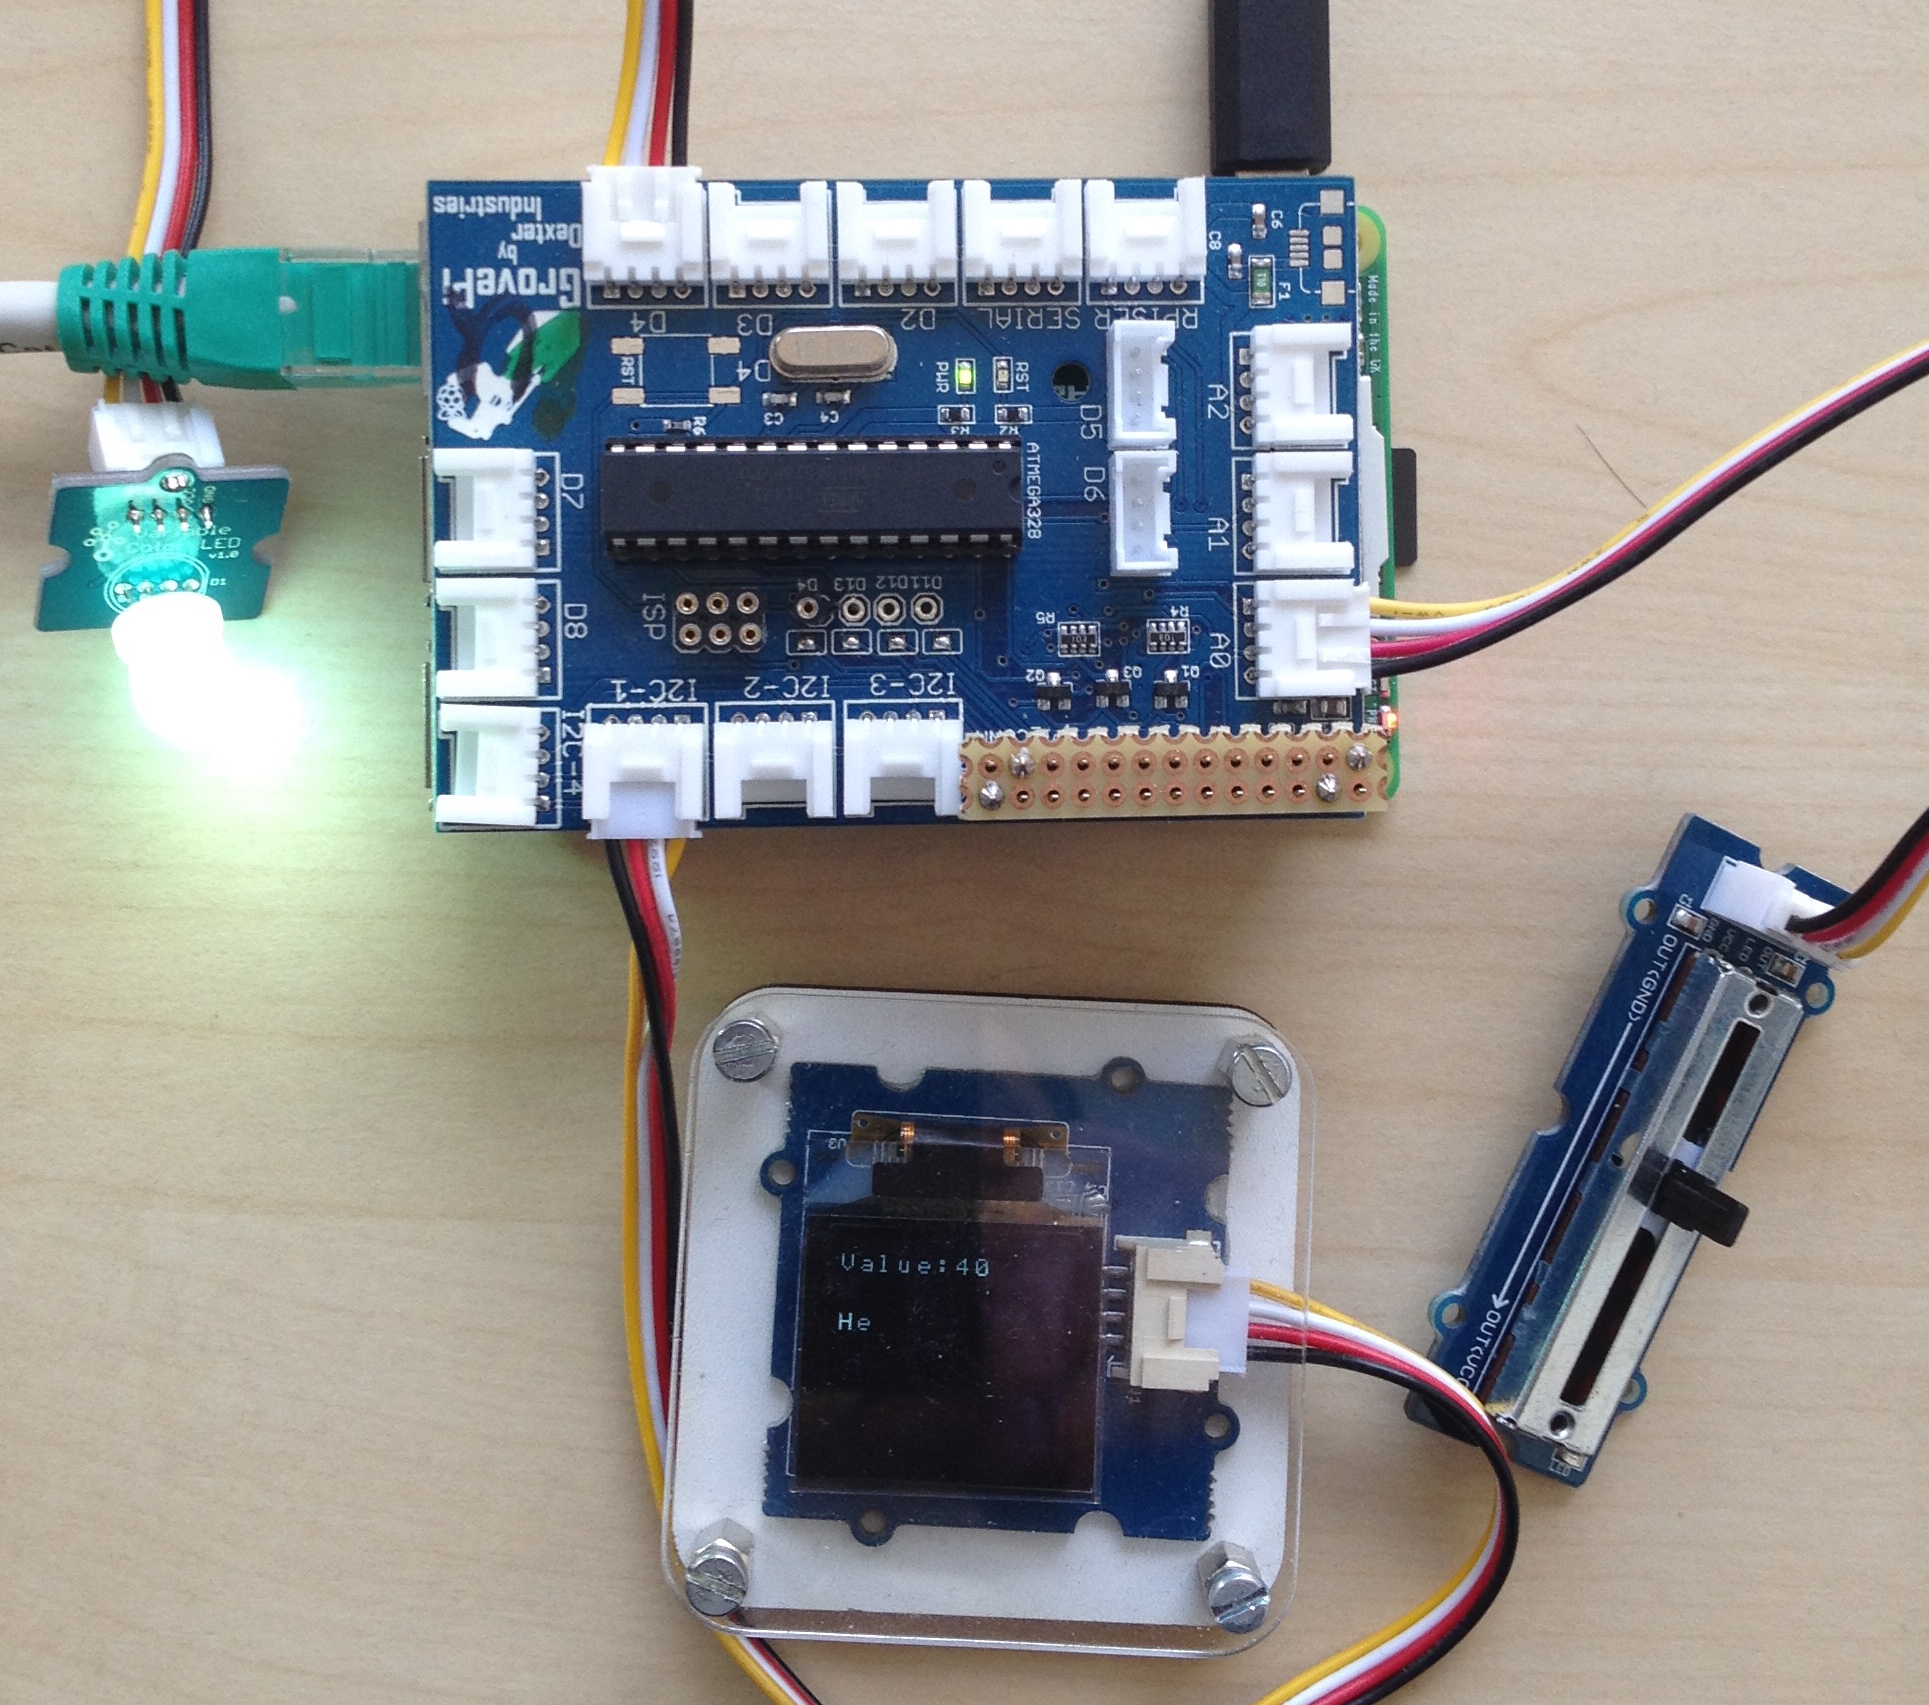 SAP has published a cloud example and an IOT Starterkit. You can find it on Github here. This repository provides information and code for working with SAP HANA Cloud Platform (HCP) IoT Services.
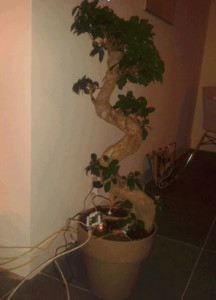
The Poseidon project is a voluntary initiative that aims to reduce water usage in the world. As a first step, the project developed educational material for monitoring the water in the soil of houseplants using an app that views sensor data from a plant to understand when the plant needs watering. The objective is to build an enthusiastic community focused on finding solutions that reduce water usage by applying technologies such as the Internet of Things (IoT), cloud computing, mobile, and analytics.
In this three-part tutorial series, you’ll build a low-cost plant-watering solution and find out how to work collaboratively to improve on it. The solution is based on Raspberry Pi and uses IBM Bluemix for collecting and visualizing sensor data and posting updates on your social network.
You can see some more nice pictures of the GrovePi in action, conserving water, on IBM’s Facebook page here.
IBM has broken this project into a three part tutorial: Part 1, Part 2, and Part 3.
Oracle
Finally Oracle is using the GrovePi to demonstrate the IoT/JavaOne API.
We want to demonstrate a connected greenhouse that reports its temperature on a regular basis, and that includes a remotely controlled light. . . . The main demonstrator is built around Eclipse Kura on the embedded side, and Eclipse Paho’s Javascript (WebSockets) client on the web/client side. The web UI allows to display the temperature in the greenhouse and a button can be pushed to toggle the light.
Smaller Cloud Examples
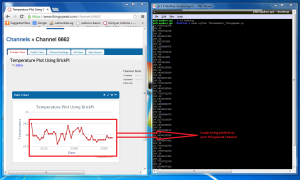
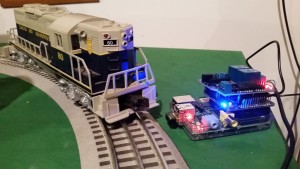 And of course our very own tutorial for setting up Weaved on the Raspberry Pi, and even better, using the Raspberry Pi to control a set of old Lionel Trains.
More to Come!
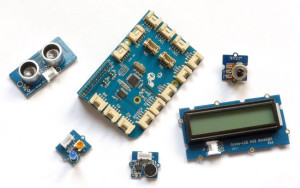 The GrovePi is an incredibly powerful piece of hardware that lets you quickly connect your physical world to the cloud through a wide range of internet of things services.
Are you working on an Internet of Things project we missed in this roundup? Are you a developer that’s interested in using the GrovePi for an Internet of Things project? We would love to hear from you!
3 Comments
-
I have just bought both grove pi and ardu pi. I am building IOT pollution monitoring systems with your hardware. Atm Im just using the test example code where it spits out the values onto a twiiter feed. I want to do data visualisation with graphs and charts so what software would you recomend I use out of these?
-
Author
Hey lukemall3tt, I would head over to our forums here, for a better discussion on visualization. Thanks!
-
-
I have very minimal background for data visualisation so any recomendations would go a long way
Leave a reply
You must be logged in to post a comment.



 Our very